vSphere Memory Counters De-Mystified
One of the recent things that I have come across are posts in the community forums regarding memory metrics or memory counters. People are always asking questions along the lines of “What do they mean?”, “How do I read these things”, “Is James really bald?”. Well, I am hoping to set out and lay this out for others so that it can be easier to understand.
First, let’s take a look at what we see in vCenter when regarding virtual machine memory. When you select a VM in vCenter or in the vSphere Client connected directly to a host, you see the following:
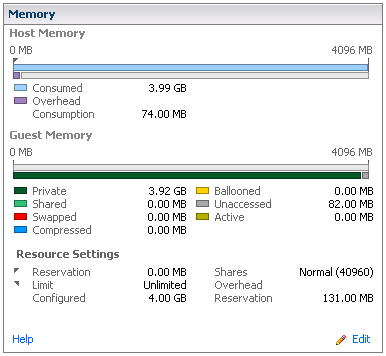
What you have in front of you is a selected color pallete, that in my opinion leaves a lot to be desired. :) Anyway, back to the issue at hand…You are presented with a “graph” of Host Memory and Guest Memory. Let’s talk about the first portion, Host Memory, as seen here:

This portion shows the host memory. Now this is not to be looked at as what is available on your host. This is a representation of the memory consumed by the VM and the overhead for the virtualization processes tied to this VM. As you can see, it shows you the consumed portion that your VM has allocated. This is not the amount of memory that your VM is actively using. This is strictly a representation of the memory that has been allocated to this VM when you deployed it or after any change made to the memory allocation on the VM. The overhead consumption is a representation of the memory in use for the virtualization processes which support this VM.
The next section is the Guest Memory, as seen here:
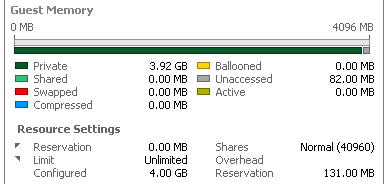
As you can see here, this section has a lot more information regarding memory statistics. This section is strictly regarding the VM Guest Memory, not the host machine. The first part of this section shows a pretty (or not so pretty) graph of the allocated memory for the VM, in this case 4GB, and the relative breakdown of the memory usage.
- Private - The amount of memory that is not being shared and is backed by the host memory. The Private Guest memory is calculated by taking the VM Allocated Memory (4GB) - Unaccessed Memory (82MB) - Shared Memory (oMB). If the VMs on your host are all actively using more than what the host has, you will see these numbers change, sometimes dramatically.
- Shared - The amount of of guest physical memory shared through transparent page sharing. This includes the memory shared with other VMs and the memory shared within the VM.
- Swapped - The amount of guest physical memory swapped out to the VM’s swap device by ESX.
- Compressed - The amount of memory currently in the compression cache for this VM.
- Ballooned - The amount of guest physical memory that is currently reclaimed through the balloon driver.
- Unaccessed - The current amount of memory not being accessed by the VM. Essentially free memory for the guest.
- Active - The amount of guest physical memory that is being used by the VM. Active memory may be different from what is seen inside the guest operating system. This is because the guest operating system generally has a more precise view about what memory is “active” than the hypervisor because it knows when applications allocate or deallocate memory. In addition, the sampling technique used by ESX often takes time to converge, so the memory usage measured in the guest operating system may be more accurate when the workload memory usage is fluctuating.
The last portion of this view is the Resource Settings. This section displays the information regarding the VM resource settings. These settings can be controlled from the VM-level and Resource Pool-level.
- Reservation - This is the guaranteed memory allocation for the VM.
- Limit - This is the configured upper limit of the VM’s memory allocation.
- Configured - This is the amount of memory configured for this VM. This is similar, if not the same as, the memory consumed by the VM.
- Shares - This is the configured memory shares for the VM.
- Overhead - This is the amount of memory being reserved for virtualization overhead.
I hope that this breakdown comes in handy for some of you out there. If you have any questions, comments, corrections then please post them in the comments!
Reference Links:
http://www.vmware.com/support/developer/vc-sdk/visdk400pubs/ReferenceGuide/memory_counters.html http://communities.vmware.com/docs/DOC-10398